


We use the open source java image analysis software ImageJ to analyze and quantify static cell adhesion, spreading and motility.
Furthermore, we have developed, in collaboration with the bioinformatics company "embedded Vision Systems" (eVS, Verona, Italy EU), the new software BeQuanti (for Behavior Quantification).
BeQuanti allows automated detection and characterization of cells interacting underflow conditions by automatically performing accurate analysis of several parameters of cell adhesion, including quantification of tethering and calculation of speed of rolling, detection of the new metric sub-rolling, classification of cellular events depending on duration of arrest, discrimination between round, polarized and spread cells and characterization of post-adhesion stabilization. The software parameters are fully customizable by the user thus allowing maximal analysis flexibility. Data analysis can be done in real time and is provided in several different output formats, including frame-by-frame data and all statistical data. The package is optimized for parallel chamber or multiple microfluidic underflow experimental settings, such as the BioFlux, and for phase contrast microscopy. Capillary tube-derived data can also be analyzed. Due to its modular architecture, the package can be easily expanded to allow cell detection and analysis under different experimental conditions. The package is compiled for Mac OS X and Windows operating systems and is available upon license directly from Fluxion or from eVS.
Wall Shear Stress calculator
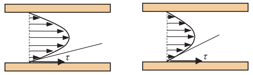
An Excel worksheet to automatically calculate the Wall Shear Stress (WSS) in underflow experiments. Download here.
The WSS is calculated from the formula:
(a) WSS = WSR x P, where WSR is the wall shear rate and P is the viscosity (0.01 for PBS).
The WSR is calculated from the formula:
(b) WSR = 8 x Vm / D, where Vm is the fluid mean velocity and D is the diameter of the tube (1.025 mm in case of Drummond glass capillary tubes).
The Vm is extracted from the formula:
(c) Q = Vm x π x D2/4, where Q is the flow rate (75 ml/hour in our case) and D is the diameter of the tube (1.025 mm).
Notably: WSS is in dyne / cm2 (1 dyne = 10-5 N); WSR is in s-1; P is in Poise; Vm is mm/s; D is in mm; Q is in ml/s.
Thus, a flow rate of 75 ml/hour corresponds to 0.021 ml/s = 21 μl/s and this is the value to be used in formula (c) to extract the Vm. The Vm value is then applied to formula (b) to calculate WSR which is finally used to calculate the WSS from the formula (a).
Cytoscape apps for network topological analysis (CBMC - 2016)
Cytoscape plugins usage chart (CBMC - 2013)
Centiscape (see the papers "Analyzing biological network parameters with CentiScaPe"; "Biological network analysis with CentiScaPe: centralities and experimental dataset integration")
Complex biological networks, such as intracellular signaling networks, are modeled by the evolution to accomplish a variety of different regulatory functions. This is achieved by controlling the overall topology of the network which, then, affects its dynamic behavior. Biological networks are hierarchichal, scale-free, modular structure in which few nodes, the hubs, play a particularly relevant topological role and this may reflect a critical role at biological level. However, also nodes with no or lower hub role may have critical regulatory role in certain biological phenomena. This could reflect node-specific topological properties. Thus, it is of interest to categorize every nodes in a network by means of topological parameters allowing scoring of the nodes according to their individual topological relevance. Computation of centrality indexes may accomplish this goal. The centrality indexes are topological parameters allowing a node-by-node quantification of the reciprocal relationship between the nodes. Centrality indexes allow classifying network nodes according to their capability to influence the function of other nodes in the network. Combination of this analysis with experimental data (node attributes) may help to identify critical nodes and regulatory circuits in a context-specific manner.
FastCentiscape is a web-based release of Centiscape, running on remote cluster, specifically designed to greatly speeding-up computation of very large networks. Results of remote computation are sent by email.
Interference (see the paper "Node Interference and Robustness: Performing Virtual Knock-Out Experiments on Biological Networks: The Case of Leukocyte Integrin Activation Network")
Centrality indexes allow categorizing nodes in complex networks according to their topological relevance (see CentiScaPe plugin). In a node-oriented perspective, centralities are very useful topological parameters to compute in order to quantify the effect of individual node(s) alteration. We have introduced the notion of interference and developed the Cytoscape plugin Interference to evaluate the topological effects of single or multiple nodes removal from a network. In this perspective, interference allows virtual node knock-out experiments: it is possible to remove one or more nodes from a network and analyze the consequences on network structure, by looking to the variations of the node centralities values. As the centrality value of a node is strictly dependent on the network structure and on the properties of other nodes in the network, the consequences of a node deletion are well captured by the variation on the centrality values of all the other nodes.
PesCa
Network analysis is of growing interest in several fields ranging from economics to biology. Several methods have been developed to investigate different properties of physical networks abstracted as graphs, including quantification of specific topological properties, contextual data enrichment, pathway dynamics and visual representation. In this context, the PesCa app for the Cytoscape network analysis environment is specifically designed to help the researchers to infer and manipulate networks based on the shortest path principle. PesCa offers different algorithms allowing network reconstruction and analysis starting from a list of genes, proteins and in general a set of interconnected nodes. The app is useful in the early stage of a network analysis, i.e. to create networks or generate clusters based on shortest path computation, but can also help further investigations and, in general, it is suitable to every situation requiring to connect a set of nodes that apparently does not share links, such as isolated nodes in sub-networks. Overall, the plugin enhances the ability of discovering interesting and not obvious relations between high dimensional set of interacting objects.
HOMECAT (see the paper "HOMECAT: consensus homologs mapping for interspecific knowledge transfer and functional genomic data integration")
HOMECAT (HOmology Mapper for Enrichment and Comparative Analysis with Translation) is a Cytoscape plugin allowing cross-species data comparison with a particular emphasis on functional genomic data (i.e. microarrays and other high throughput biological data sources). The aim at the basis of this software is to ease knowledge transfer from different species. Networks can be enriched with orthologs from other species, in the desired format. Orthology assessment is a complex task, user can combine different sources of homology prediction, with different specificity and sensitivity, to allow achieving the desired level of precision and coverage. The data integration is eased by the possibility of choosing between nearly 30 identifiers formats (Uniprot, RefSeq, Ensembl, etc.) and 71 microarrays platforms identifiers (including Affymetrix, Illumina and Agilent) designed for the 30 organisms supported by the current version. Homology data can be used to enrich existing networks or to create new data visualization that improve external data loading and mapping. A specific interface allows the download of curated data directly from Array Express ATLAS database, and several functionalities ease the comparison of data from different networks. Once data is integrated in the user networks any Cytoscape functionality can be used to analyze, visualize and process the data.
Network Randomizer (A tool for creating random networks and comparing them to the real ones)
Network Randomizer is a Cytoscape app for generating random networks, as well as randomizing the existing ones, by using multiple random network models. Further, it can process the statistical information gained from the these networks in order to pinpoint their special, non-random characteristics. It covers many popular random network models: Erdős–Rényi, Watts–Strogatz, Barabási–Albert, Community Affiliation Graph, edge shuffle, degree preserving edge shuffle, but it also features a new model which is based on the node multiplication. The statistical module is based on the two-sample Kolmogorov-Smirnov test. It compares random and real networks finding the differences between them and thus providing insights into non-random processes upon which real networks are built.
Network Randomizer's manual: https://docs.google.com/document/d/1e2t8ethp4YUYWvtpjZ_CwF081J_71snbVt8SlGfna0g/edit?usp=sharing.